All projects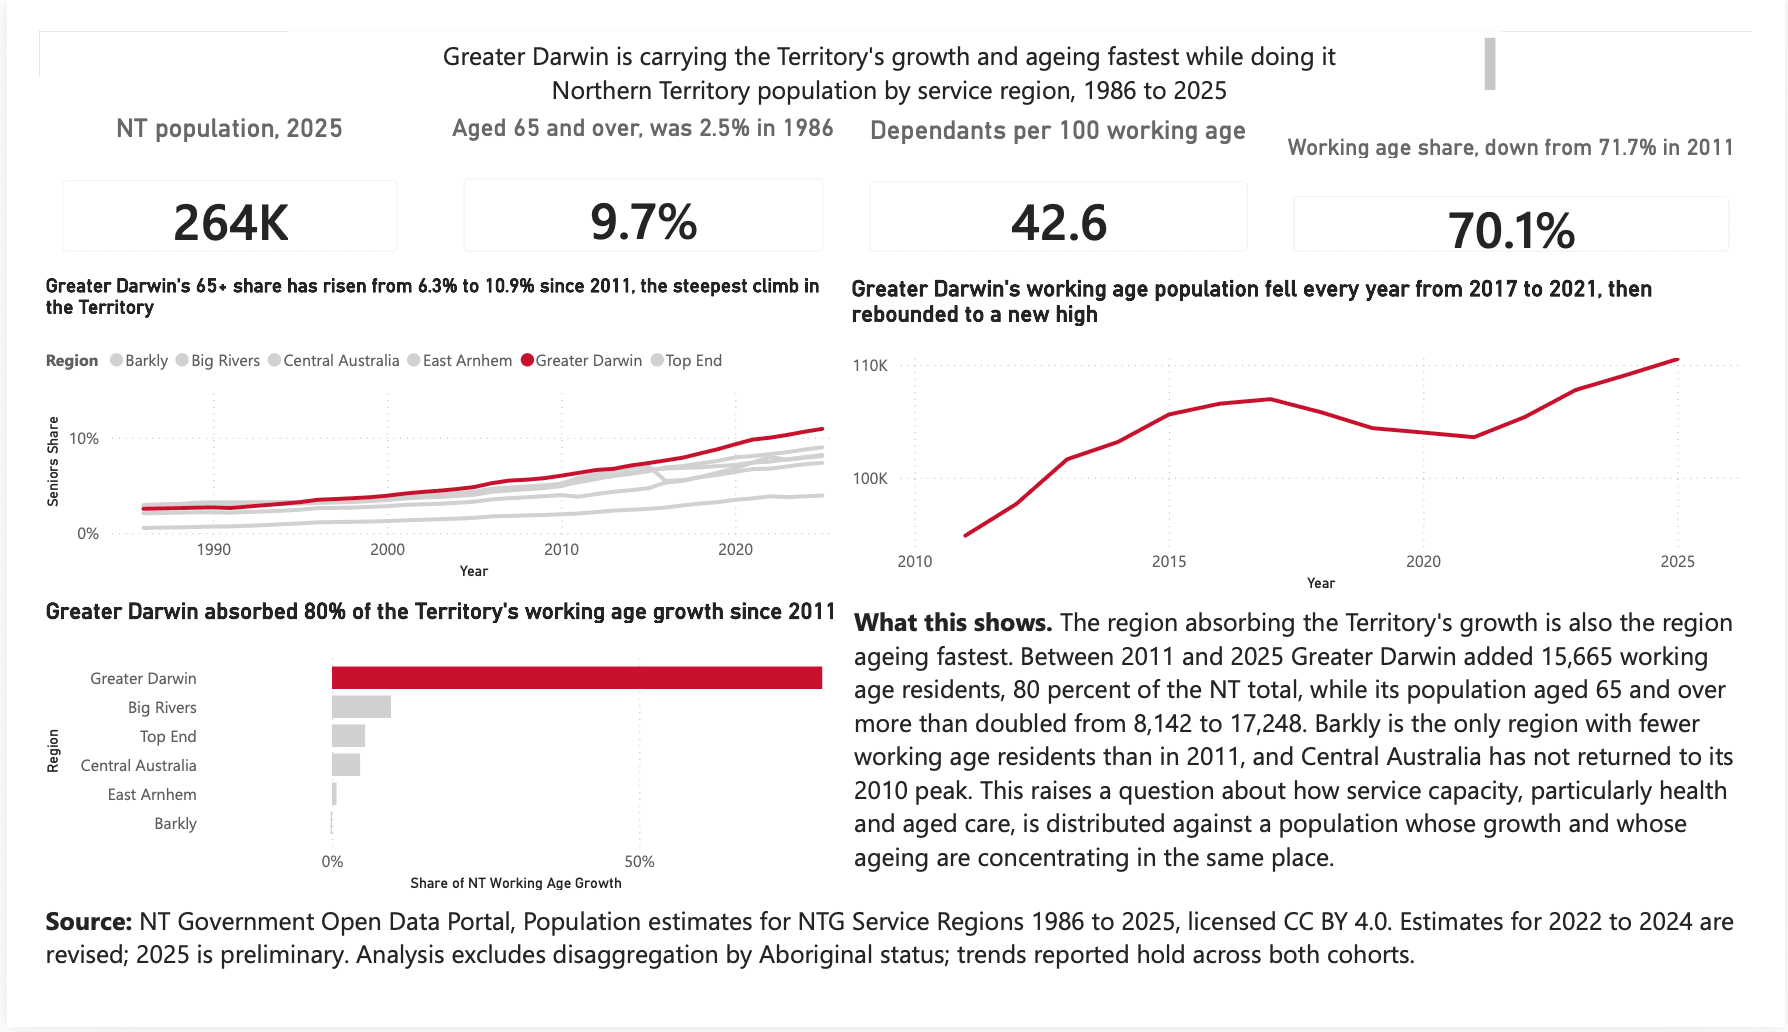
Solo analyst — data modelling, DAX, report design · 2026
NT Population Analysis
Greater Darwin is absorbing 80% of the Territory's growth — and ageing fastest while it does.
Power BIDAXPower Query (M)Data Modelling
The problem
The Northern Territory's population data is public, but nobody had turned 40 years of it into a single answer to the question service planners actually need: which regions are growing, which are ageing, and are those the same places?
The approach
- Modelled 17,280 records across six NT service regions spanning 1986–2025, sourced from the NT Government Open Data Portal
- Built 12 DAX measures in a dedicated measures table and derived custom sort and life-stage columns in Power Query
- Designed a single-page report for decision makers — every chart titled with a finding, not a field — using deliberate visual choices to foreground Greater Darwin against the other five regions
- Validated record counts and totals against published figures, flagged preliminary vs. revised data vintages, and confirmed the trends held across both reported population cohorts before publishing
The impact
80%Share of the Territory's working-age growth since 2011 absorbed by Greater Darwin
17,280Records analysed across six NT service regions, 1986–2025
12DAX measures built in a dedicated measures table